Syntax - Level 2 (W2)
- Q1 -
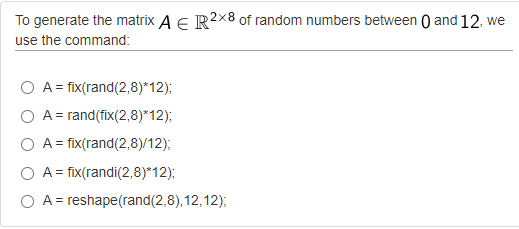
The command A = fix(rand(2, 8) * 12) generates a matrix A ∈ ℝ^(2×8) of random integers between 0 and 12 in MATLAB.
rand(2, 8) generates a matrix of random numbers between 0 and 1 with dimensions 2×8, similar to the previous explanation.
* 12 scales the random numbers by multiplying them by 12, similar to the previous explanation.
fix() is a MATLAB function that rounds each element of the matrix towards zero to obtain the nearest integer. In this case, it ensures that the elements of the matrix are integers rather than floating-point numbers.
Correct answer is A.
- Q2 -
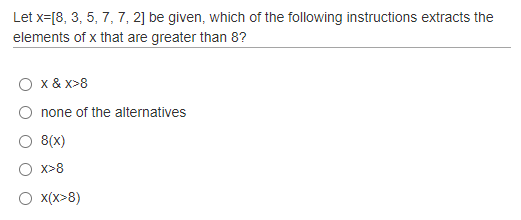
From MATLAB documentation: “Use the vector of logical values as an index to view the values in A that are greater than 10.”
A(A>10)Correct answer is E.
- Q3 -
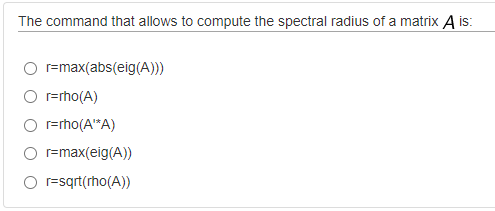
The command that allows us to compute the spectral radius of a matrix A in MATLAB is max(abs(eig(A))).
Correct answer is A.
- Q4 -
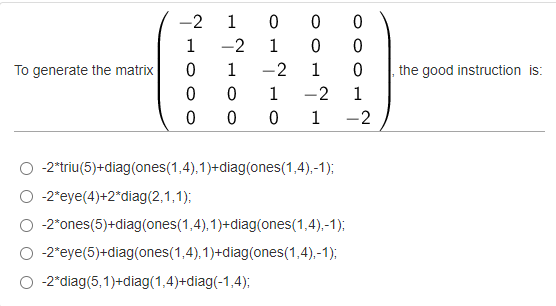
-2*eye(5) creates a 5x5 matrix with -2 on the diagonal and zeros elsewhere. The eye(5) function generates a 5x5 identity matrix, and multiplying it by -2 gives a matrix with -2 on the diagonal.
diag(ones(1,4),1) creates a 5x5 matrix with ones on the first upper diagonal (above the main diagonal) and zeros elsewhere. The ones(1,4) function generates a row vector of four ones, and diag(..., 1) places these ones on the first upper diagonal.
diag(ones(1,4),-1) creates a 5x5 matrix with ones on the first lower diagonal (below the main diagonal) and zeros elsewhere. The diag(..., -1) places the ones on the first lower diagonal.
Correct answer is D.
- Q5 -
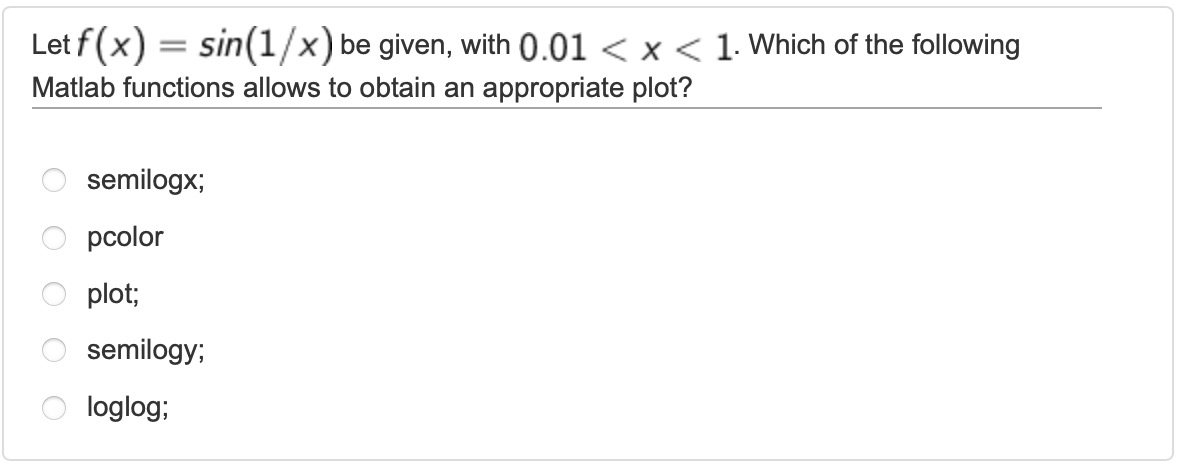
To obtain an appropriate plot of the function f(x)=sin(1/x) with the range 0.01 < x < 1 in MATLAB, we can use the semilogx function.
The semilogx function is specifically designed for plotting data on a logarithmic scale along the x-axis. In this case, since the range includes values close to zero, a logarithmic scale for the x-axis can be helpful to visualize the function properly.
In other words, in this question our x values are close to 0 and in a logaritmic scale(small number or big number) so we use semilogx.
Correct answer is A.
- Q6 -
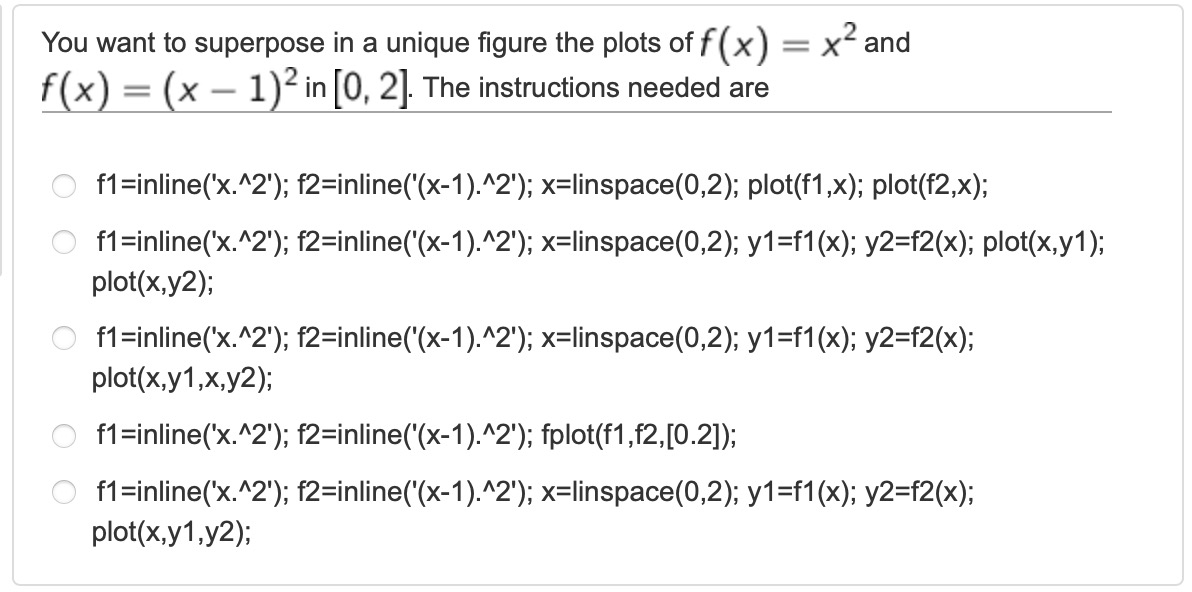
The question asks us to plot two functions, on the interval [0,2] in a single figure using MATLAB. To do this, we need to define a range of x-values within the interval [0,2]. Then, calculate the corresponding y-values for each function using element-wise operations. Next, create a new figure and plot the first and second function, using the same plot function.
Correct answer is C.
- Q7 -
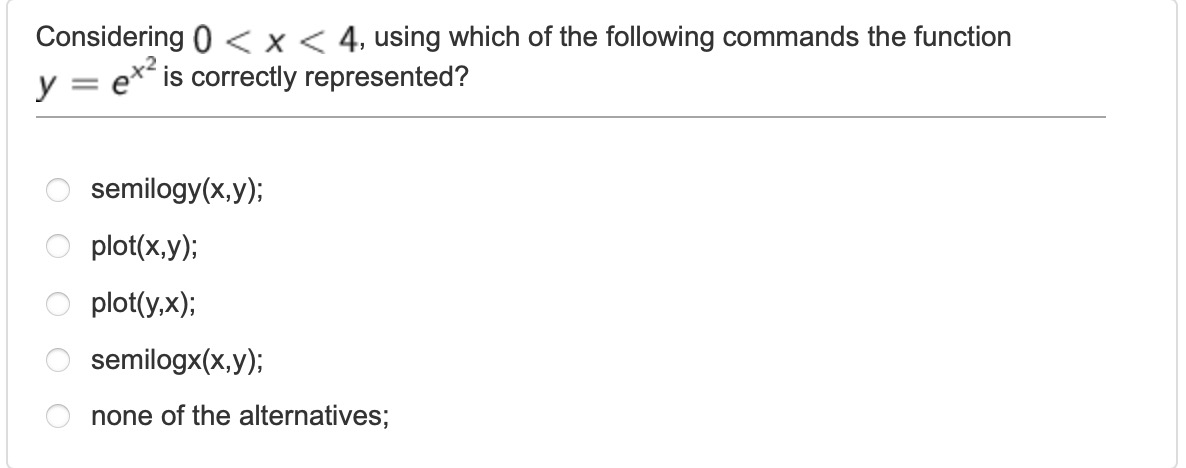
To correctly represent the function y=e^x^2 for the range 0 < x < 4 in MATLAB the appropriate command is semilogy.
The semilogy function is used to plot data on a logarithmic scale along the y-axis. Since the function can have a wide range of values, a logarithmic scale on the y-axis can help visualize it properly.
Correct answer is A.
- Q8 -
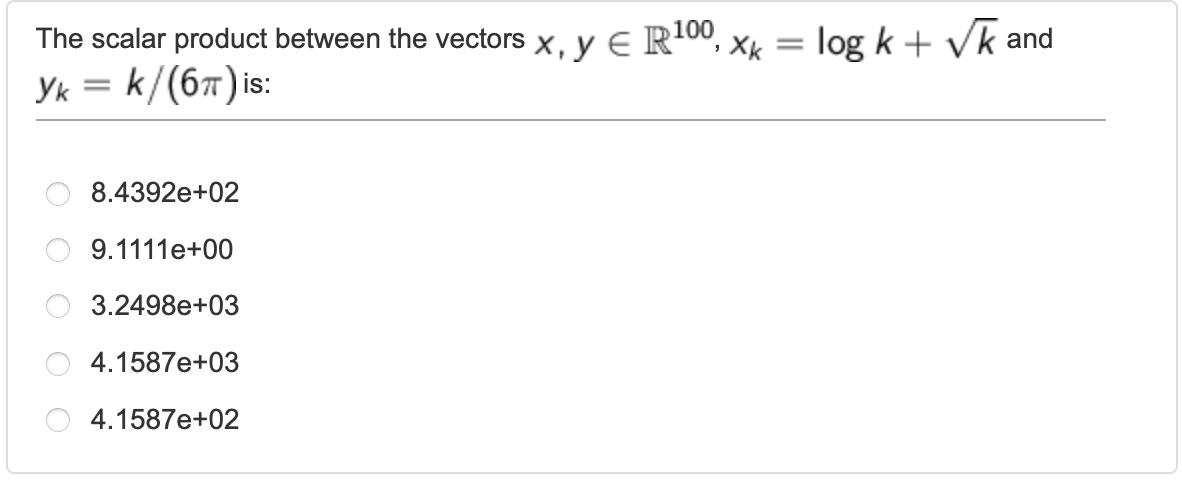
clear all

for k = 1:100
    x(k) = log(k)+sqrt(k);
    y(k) = k/(6*pi);
end
format short e
dot(x,y)
Correct answer is 3.2498e+03, in this case, C.
- Q9 -
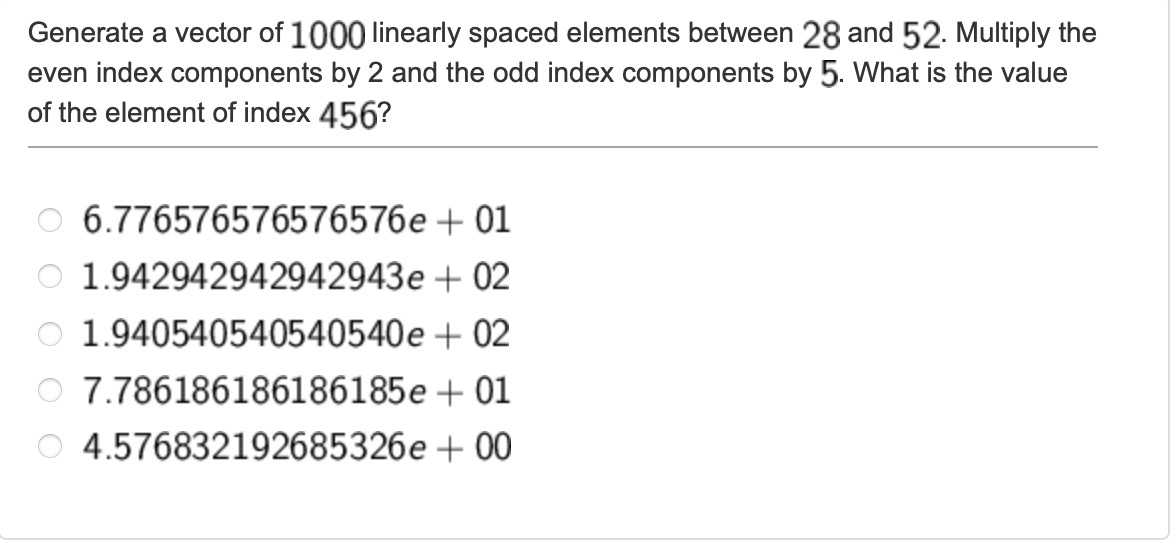
clear all

A = linspace(28, 52, 1000);
A(2:2:end) = A(2:2:end) * 2;
A(1:2:end) = A(1:2:end) * 5;

format long e
A(456)
linspace(28, 52, 1000) generates a vector A of 1000 linearly spaced elements between 28 and 52.
A(2:2:end) selects the even-indexed components of the vector A.
A(2:2:end) = A(2:2:end) * 2 multiplies the even-indexed components by 2.
A(1:2:end) selects the odd-indexed components of the vector A.
A(1:2:end) = A(1:2:end) * 5 multiplies the odd-indexed components by 5.
Correct answer is 7.786186186186185e+01, in this case, D.